- Analyzed Investing
- Posts
- Latest CPI Shows Core Inflation Still Rising—Here's What That Means For You
Latest CPI Shows Core Inflation Still Rising—Here's What That Means For You
February’s CPI data reveals that while headline inflation remains steady, core inflation is still climbing—keeping pressure on interest rates and shaping market opportunities. In this edition, we break down what these numbers mean for investors, the potential impact of rising energy prices, and how to position your portfolio in an environment of persistent inflation.
Analyzed Investing
March 13, 2026
March 13, 2025
Inflation Update: What the Latest CPI Data Tells Us
Earlier this week, the Bureau of Labor Statistics (BLS) released the Consumer Price Index (CPI) report for February 2026, revealing that inflationary pressures remain persistent. On a seasonally adjusted basis, headline CPI increased by 0.3% in February, following a 0.2% rise in January. Over the 12 months ending in February, the "all items" index rose 2.4%, matching the year-over-year figure reported for January.

"Core" inflation—the measure excluding volatile food and energy components—also tells a story of stickiness. Core CPI rose 0.2% on a monthly basis in February and sits at 2.5% over the last 12 months, mirroring the previous month’s reading. Shelter costs, which remain a primary driver of the index, rose 0.2% for the month, while energy costs edged up 0.6% as gasoline and natural gas prices experienced upward pressure.
Why the 2% Goal Feels Distant
While the current rates represent a significant cooling from the highs of recent years, progress toward the Federal Reserve’s 2% inflation target has clearly plateaued. The persistence in core services, combined with renewed volatility in energy markets, suggests that the "last mile" of disinflation is proving to be the most difficult.

CPI vs. PCE: Why the Fed Looks Elsewhere
It is important for investors to distinguish between the CPI and the Personal Consumption Expenditures (PCE) price index. While the CPI often grabs the headlines and is used for cost-of-living adjustments (like Social Security), the Federal Reserve prioritizes the PCE.
The two indices differ in several key ways that can impact how policymakers view the economy:
Scope: CPI tracks only out-of-pocket expenditures by urban households. The PCE is more comprehensive, capturing all spending on behalf of households, including third-party payments like employer-provided health insurance or government-funded programs like Medicare.
Weighting: The PCE index is more dynamic; it updates its basket of goods more frequently to account for "substitution effects"—the tendency of consumers to switch to cheaper alternatives when prices rise.
Formula: Because the PCE better accounts for these changes in consumer behavior, it generally tends to provide a slightly lower, and often more stable, reading of inflation than the CPI.
Understanding these differences is crucial: even if CPI data remains "sticky" at 2.4%–2.5%, the Fed will be watching the PCE data closely to determine if the underlying trend is actually closer to their 2% mandate.
The Geopolitical and Energy Angle
While we do see a cooling trend in the February CPI data, it is important to keep in mind that this serves as a "rearview mirror." The most significant challenge to the inflation outlook is currently unfolding in real-time, far from the consumer goods aisles: the escalating conflict in the Middle East.
The Energy Chokepoint

The current US-Israel military standoff against Iran has effectively paralyzed the Strait of Hormuz. This narrow waterway is perhaps the most critical energy chokepoint in the world, carrying roughly 20% of global oil and liquefied natural gas (LNG) consumption. As shippers suspend operations and regional infrastructure faces threats of damage, the global supply chain is experiencing a sudden, major supply shock. This physical disruption has created the largest oil supply shock in modern history, with major producers in the Gulf region forced to curtail output significantly.
To make matters worse, maritime insurers have responded with extraordinary swiftness, effectively pricing the Strait of Hormuz out of the global shipping market. As conflict persists, underwriters in the London market and beyond have moved from simple premium hikes to outright cancellation notices for "war risk" coverage.
For a standard Very Large Crude Carrier (VLCC) valued at $100 million, war-risk premiums—which typically hovered between 0.1% and 0.25% of the vessel’s value—have spiked to as high as 1.0% for a single transit. This converts a manageable operational cost into a prohibitive capital expenditure, adding over $1 million to the cost of a single voyage. When insurers cannot provide price certainty or refuse to quote altogether, shipping firms are left with no choice but to ground their fleets or reroute around the Cape of Good Hope, adding weeks to transit times and further tightening an already constricted global supply chain.
Impacts on Consumer Prices
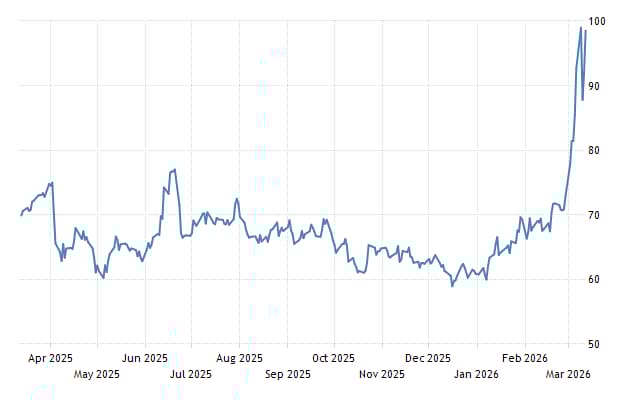
The market’s response to these severe supply chain stresses have been severe, with Brent Crude prices surging close to the $100 per barrel mark in recent sessions—a level not seen since 2022.
Because energy costs are a foundational input for almost every sector of the economy, this shock transmits through three primary channels:
Direct Consumer Costs: The most immediate effect is at the pump and on household utility bills. Gasoline, heating oil, and electricity costs are highly sensitive to crude price fluctuations.
Transportation and Logistics: As maritime routes are blocked or forced to detour around the Cape of Good Hope, freight and shipping costs have spiked. This creates a "second-round" effect, where the cost of moving goods—from perishables to industrial components—rises, inevitably being passed on to the consumer.
Production and Feedstock: Energy is a core raw material for chemical, plastic, and manufacturing industries. Higher energy input costs increase the cost of production, forcing companies to either absorb lower margins or hike final product prices to maintain profitability.
The "Sticky" Inflation Trap
Economists are particularly concerned because this is a supply-side shock. Unlike demand-driven inflation, which the Federal Reserve can dampen by raising interest rates to cool consumer spending, the Fed has very limited tools to address a shortage of oil.

If this disruption remains sustained, it threatens to reverse the progress made toward the 2% target. Current forecasts suggest that if oil prices settle consistently in the $100 per barrel range, headline inflation could be pushed back above 3.5% through the remainder of 2026.
For investors and households, energy markets have shifted from a background consideration to the single most critical variable that could determine the trajectory of inflation, interest rates, and overall market volatility in the coming months.
What This Means for Markets and Monetary Policy
The convergence of sticky core inflation and a sudden, supply-side energy shock has placed the Federal Reserve in a precarious position. For investors, the "pivot" narrative that dominated market optimism at the start of the year is rapidly being replaced by a more sober reality: the higher-for-longer regime may be back on the table.
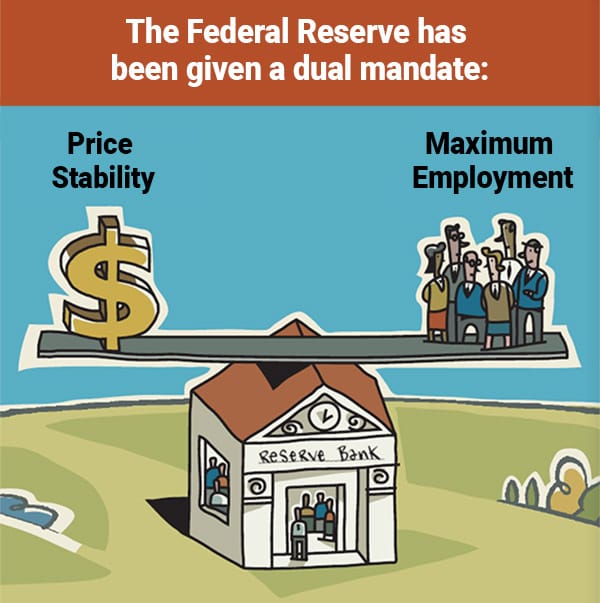
The Federal Reserve’s Dilemma
The Federal Open Market Committee (FOMC) operates under a dual mandate: maximum employment and price stability. Usually, these goals can be balanced, but energy shocks create a "stagflationary" trap.
The Price Stability Problem: Because this is a supply-side shock, raising interest rates cannot create more oil or lower the price of shipping. However, the Fed remains terrified of letting inflation expectations "de-anchor." If businesses and consumers begin to expect that 3% inflation is the new normal, it becomes self-fulfilling.
The Policy Response: Markets have drastically repriced their expectations, now anticipating fewer (or even zero) rate cuts for the remainder of 2026. The Fed is likely to maintain the current federal funds rate in the 3.50%–3.75% range to ensure inflation does not spiral. Should oil prices sustain levels above $110/barrel, the risk of a "hawkish surprise"—where the Fed signals that future rate hikes are not entirely off the table—grows.
Market Volatility and Investor Positioning
Equity markets, which had rallied on the assumption of a smooth "soft landing" and consistent rate cuts, are now entering a period of increased sensitivity.
Valuation Compression: Higher interest rates raise the "discount rate" used to value future earnings. In an environment where the Fed is sidelined, high-growth stocks, particularly in the tech sector, may face pressure as investors demand higher risk premiums.
The "K-Shaped" Economy: We are seeing a divergence in how companies handle this environment. Larger, capital-rich corporations may be able to absorb higher energy costs through operational efficiency or pricing power. Smaller businesses, however, are facing a squeeze on margins that could lead to volatility in the broader market.

It seems evident that the current landscape rewards a "barbell" strategy: maintaining exposure to high-quality companies with strong balance sheets that can navigate high input costs, while holding cash or short-term fixed income instruments that benefit from the current high-yield environment.
Strategy Spotlight: The SP10
In today’s market, we are witnessing a profound K-shaped recovery. While certain sectors—driven by AI, digital transformation, and high-end consumer spending—soar, other parts of the economy continue to grapple with persistent inflation and the weight of restrictive interest rates.
This bifurcation isn't just a headline—it's a fundamental shift in how capital is being rewarded. In an environment where the "haves" are pulling away from the "have-nots," betting on the broader market indices—which are dragged down by struggling, debt-heavy firms—may be a recipe for stagnation.
Why Concentration is Your Best Defense
When the economic path is uncertain, you don't want broad exposure to mediocrity; you want surgical exposure to dominance.
Surmount’s SP10 Strategy is designed for this exact environment:

Stellar Balance Sheets: By focusing exclusively on the ten largest companies in the S&P 500, we prioritize firms with immense cash reserves and low reliance on volatile, high-cost debt. These are the companies that don't just survive during credit crunches—they thrive, using their liquidity to acquire competitors and invest in future growth while others scramble for survival.
Economic Moats: These are not just stocks; they are the infrastructure of the global economy. From the tech platforms powering modern communication to the consumer giants that define discretionary spending, these leaders possess the pricing power to protect their margins even when inflationary pressures mount.
Institutional Liquidity: In times of market panic, liquidity is king. Our strategy ensures you are positioned in the most widely traded, liquid assets on the planet, allowing you to react with precision as market conditions evolve.
We aren't looking to "beat the market" by picking speculative long shots. We are betting on the market's most powerful drivers.
We maintain a disciplined, quarterly rebalancing protocol that strips out emotion. If a company drops out of the top ten, it is removed. If a new titan emerges, it is added. This ensures your capital is perpetually concentrated in the ten most influential, profit-generating forces in the U.S. economy.
Stop settling for average returns in an economy that is anything but average.
This Week’s Takeaways
February CPI rose 0.3% monthly and 2.4% annually, with core inflation steady at 2.5%, showing persistent price pressures.
Shelter and energy costs drove stickiness, making the Fed’s 2% inflation target seem increasingly distant.
CPI differs from the Fed-preferred PCE, which captures broader spending and often shows slightly lower inflation trends.
Middle East tensions disrupted the Strait of Hormuz, triggering the largest modern oil supply shock and surging energy costs.
Supply-driven inflation limits the Fed’s tools, pressuring markets, sustaining high rates, and favoring resilient, capital-rich companies.
Until next week,
Analyzed Investing
Want more like this?
I publish deeper dives and contrarian macro analysis at AnalyzedInvesting.com.
You can also find me on StockTwits and X.